22 May 2021
New data from Public Health England (PHE) suggests that the vaccines (both AstraZeneca and Pfizer) are up to 90% effective in preventing symptomatic infection in the over-65s when fully vaccinated.
This is a remarkable result and was widely reported in the media. It is notably much better than the trial data for AstraZeneca, which suggested only 70% efficacy for all ages.
So much better, in fact, that one wonders if something has gone wrong with one or the other study. How can a vaccine be 70% effective for all ages in a controlled trial then 90% effective in the over-65s in the real world? The authors of the PHE study did not compare their results to the AstraZeneca trial or attempt an explanation so we are none the wiser.
The new findings come from the second instalment of a weekly vaccine surveillance report from PHE. The first coincided last week with a peer-reviewed article in the BMJ which set out the study design and method in full. I’ve gone through this study and discussed it at length with others who are medically qualified and we’ve identified a number of issues that are worth flagging up as they call into question the reliability of the results.
What have the authors done? They’ve looked at all the Pillar 2 testing data for England (in the community, so not hospitals) and narrowed it down to “156,930 adults aged 70 years and older who reported symptoms of COVID-19 between December 8th 2020 and February 19th 2021 and were successfully linked to vaccination data in the National Immunisation Management System”. They excluded various test results, including when there are more than three negative follow-ups for the same person and anyone who had tested positive prior to the study.
They have then used this data to compare symptomatic infection rates between those who are vaccinated and unvaccinated, breaking it down by age, vaccine type, and days since vaccination.
Here’s the table of the people in their study.
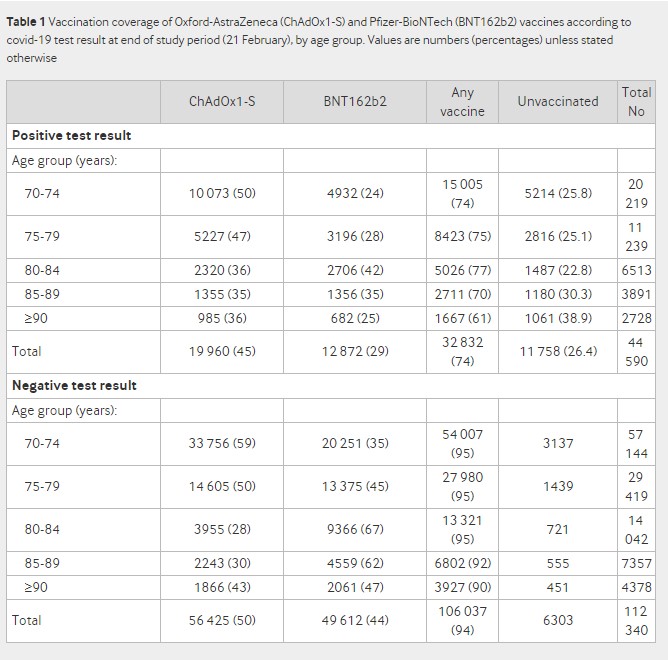
The first thing to note is the huge difference in the positivity rate between vaccinated and unvaccinated groups. It is 24% in the vaccinated (32,832/(32,832+106,037)) and 65% in the unvaccinated (11,758/(11,758+6,303)). This wide disparity and very high positivity rate cast doubt on the extent to which these can be considered representative groups that can fairly be compared or the results generalised to the population.
The next strange thing about the study is the authors split it into two, giving results separately for people vaccinated before January 4th and after January 4th. They explain this stratification as follows:
The odds of testing positive by interval after vaccination with BNT162b2 [Pfizer] compared with being unvaccinated was initially analysed for the full period from the roll-out of the BNT162b2 vaccination programme on December 8th 2020. During the first few days after vaccination (before an immune response would be anticipated), the odds of vaccinated people testing positive was higher, suggesting that vaccination was being targeted at those at higher risk of infection. The odds ratios then began to decrease from 14 days after vaccination, reaching 0.50 (95% confidence interval 0.42 to 0.59) during days 28 to 34, and remained stable thereafter. When those who had previously tested positive were included, results were almost identical. Stratifying by period indicated that vaccination before January 4th was targeted at those at higher baseline risk of COVID-19, whereas from January 4th (when ChAdOx1-S [AstraZeneca] was introduced), delivery was more accessible for those with a similar baseline risk to the unvaccinated group. A stratified approach was therefore considered more appropriate for the primary analysis.
What this is saying is that they initially got the results for the full period and they noticed the post-vaccine spike that we have been drawing attention to. However, they found that it only happened in those vaccinated prior to January 4th (we will look at this claim in more detail shortly) and so concluded that that cohort was at higher risk of infection, and hence the results would be more reliable if they were split into two cohorts. This adds complexity to the study and means it does not have a single set of findings.
The authors later elaborate on this explanation for the post-vaccination spike.
A key factor that is likely to increase the odds of vaccinees testing positive (therefore underestimating vaccine effectiveness) is that individuals initially targeted for vaccination might be at increased risk of SARS-CoV-2 infection. For example, those accessing hospital may have been offered vaccination early in hospital hubs but might also be at higher risk of COVID-19. This could explain the higher odds of a positive test result in vaccinees in the first few days after vaccination with BNT162b2 (before they would have been expected to develop an immune response to the vaccine) among those vaccinated during the first month of the roll-out. This effect appears to lessen as the roll-out of the vaccination programme progresses, suggesting that access to vaccines initially focused on those at higher risk, although this bias might still affect the longer follow-up periods (to which those vaccinated earliest will contribute) more than the earlier follow-up periods. This could also mean that lower odds ratios might be expected in later periods (i.e., estimates of vaccine effectiveness could increase further). In the opposite direction, vaccinees might have a lower odds of a positive COVID-19 test result in the first few days after vaccination because individuals are asked to defer vaccination if they are acutely unwell, have been exposed to someone who tested positive for COVID-19, or had a recent coronavirus test. This explains the lower odds of a positive test result in the week before vaccination and may also persist for some time after vaccination if the recording of the date of symptom onset is inaccurate. Vaccination can also cause systemic reactions, including fever and fatigue. This might prompt more testing for COVID-19 in the first few days after vaccination, which, if due to a vaccine reaction, will produce a negative result. This is likely to explain the increased testing immediately after vaccination with ChAdOx1-S and leads to an artificially low vaccine effectiveness in that period.
The authors then go on to consider, for the first time in a published study, the possibility that the infection spike could be a result of immune suppression, and dismiss it.
An alternative explanation that vaccination caused an increased risk of COVID-19 among those vaccinated before January 4th through some immunological mechanism is not plausible as this would also have been seen among those vaccinated from January 4th, as well as in clinical trials and other real world studies. Another explanation that some aspect of the vaccination event increases the risk of infection is possible, for example, through exposure to others during the vaccination event or while travelling to or from a vaccination site. However, the increase occurs within three days, before the typical incubation period of COVID-19. Furthermore, if this were the cause, we would also expect this increase to occur beyond January 4th.
It is odd they claim that it is not seen in the trials and other population studies because it certainly is, as Dr Clare Craig has noted, and there is direct evidence of a possible immune suppression effect from the vaccines which they do not engage with. As for not being present after January 4th, as we shall see, that is only true following some very severe adjustments to the data.
Notable is that they don’t attempt to blame people for taking risks and getting themselves infected after the jab, which has become the go-to explanation for those who want to bat the issue away but for which there is no real evidence.
How then does their own preferred explanation stack up? Is it true that those vaccinated before January 4th were higher risk than those vaccinated afterwards?
Consider that by January 4th only 10% of care home residents had been vaccinated, but 23% of all over-80s. This was largely to do with the logistical challenges of using the Pfizer vaccine in care homes. Also, many hospitals had a policy of not vaccinating inpatients. This means that it was mainly less frail over-80s who were vaccinated before January 4th. Then, after January 4th, vaccinations were stepped up and the rest of the care home residents were quickly vaccinated along with the rest of the over-80s and then the over-70s.
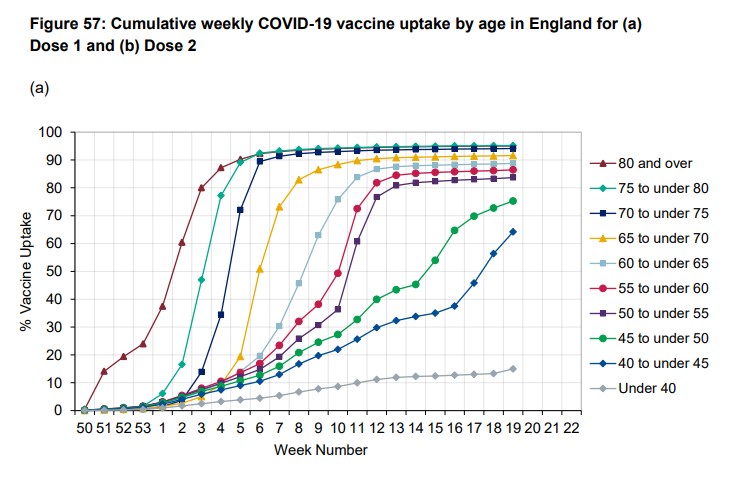
Thus it doesn’t appear to be the case that the pre-January 4th cohort was at much higher risk of infection than the post-January 4th cohort. Interestingly, the authors don’t try to claim that the supposedly higher risk arises because care home residents are prominent in the earlier cohort as they are aware that “few care home residents were vaccinated in the early period”.
Here’s the table of their results for the pre-January 4th cohort (over-80s).
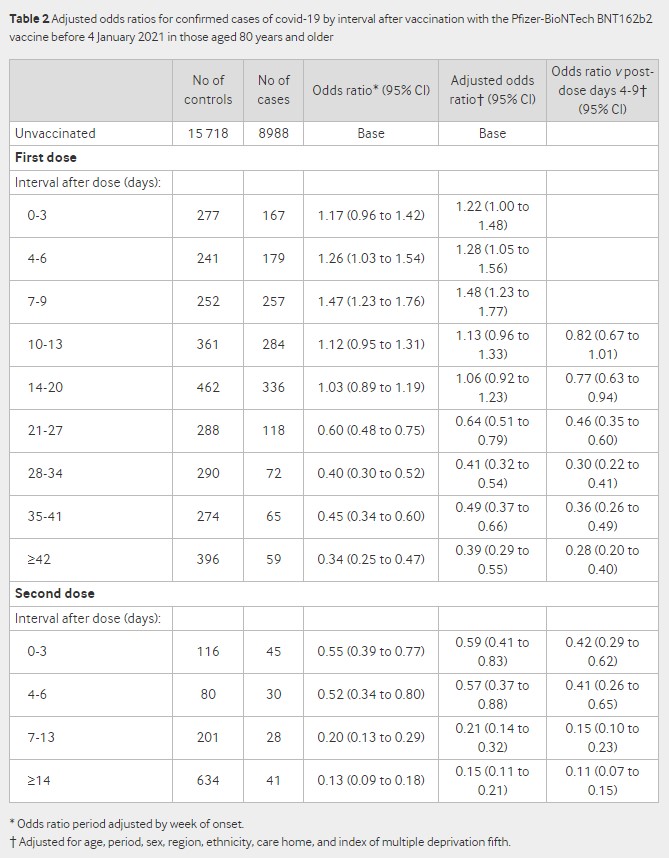
Notice how it hits 47% higher infection rate 7-9 days post-jab (48% higher after adjustments). Observe also that the odds ratio after the second dose is elevated compared to the later odds ratios after the first dose – 45% lower (the 0.55 at days 0-3 after second dose) compared to 66% lower (the 0.34 at over 42 days after first dose, looking at the unadjusted figures) – perhaps suggesting a similar effect.
The other thing to note is that the unvaccinated baseline is static and we don’t get figures for different periods. To be fair, even the unadjusted odds ratio is adjusted for the week of symptom onset, because the authors recognise that “the variation in both disease incidence and vaccine delivery in England over the study period meant that an analysis without including time would not be meaningful”. However, with a static baseline it’s hard to know whether this adjustment has been done satisfactorily. Here’s the graph (from the supplementary material) showing how incidence varied over the period.
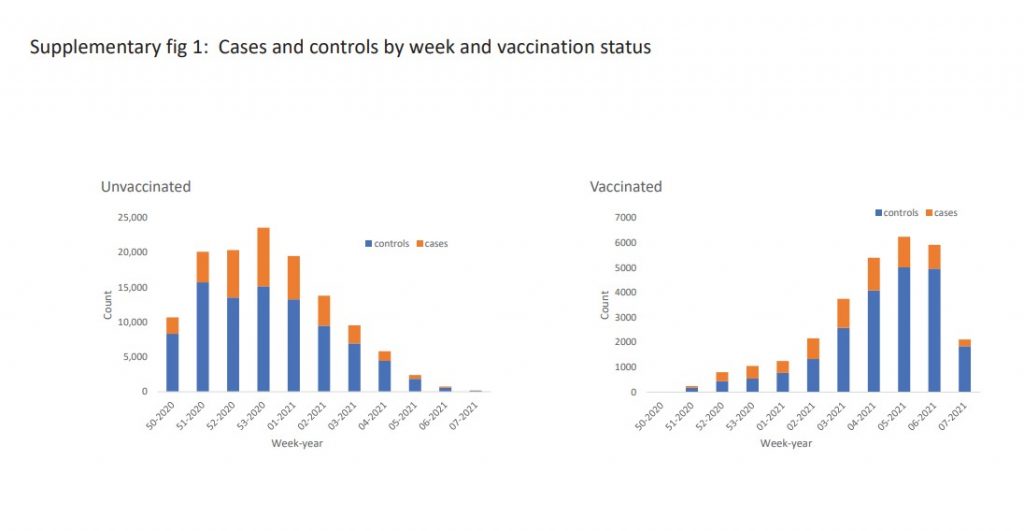
In this raw data we can see the big changes in how many were vaccinated and how many were testing positive. Particularly notable are the positivity rates in the vaccinated in the early weeks. For the first few weeks up to half of all tests in vaccinated people (the orange bars in the right hand graph) are positive. Also notice that the positivity rate in the unvaccinated drops considerably by week four and five of 2021, indicating that vaccination was not the only thing bringing incidence down over the period. How well these big changes in incidence have been adjusted for while using a static baseline is hard to tell. For instance, it is unlikely to be the case that over 14 days after the second dose the vaccinated are really recording 85% fewer cases than the unvaccinated at the same time, as by that point background incidence will also have dropped considerably.
To illustrate, here’s an example of another study, this one in care homes, that shows how the vaccinated and unvaccinated infection rates vary over time.

Notice that unvaccinated residents, 42 days after vaccinations took place in their care home, have a 0.3% infection rate, exactly the same infection rate as the fully vaccinated 14 days after their second dose. Also, the vaccinated have a higher infection rate in the days after their second dose than the unvaccinated do at the same point – 1% vs 0.4%. This doesn’t mean that vaccines don’t work, but it means trying to show how well they work by comparing infection rates when infections are rising and falling anyway is very tricky. (In this study, because the residents all live together in care homes, the authors claim it’s the herd immunity from the vaccinated that brings the rate down for the unvaccinated. It is not possible to show that either way on this data, but more generally we know that background infection rates drop independently of vaccination.)
Back to the PHE study. Here’s the table of results for the post January 4th cohort (over-70s).
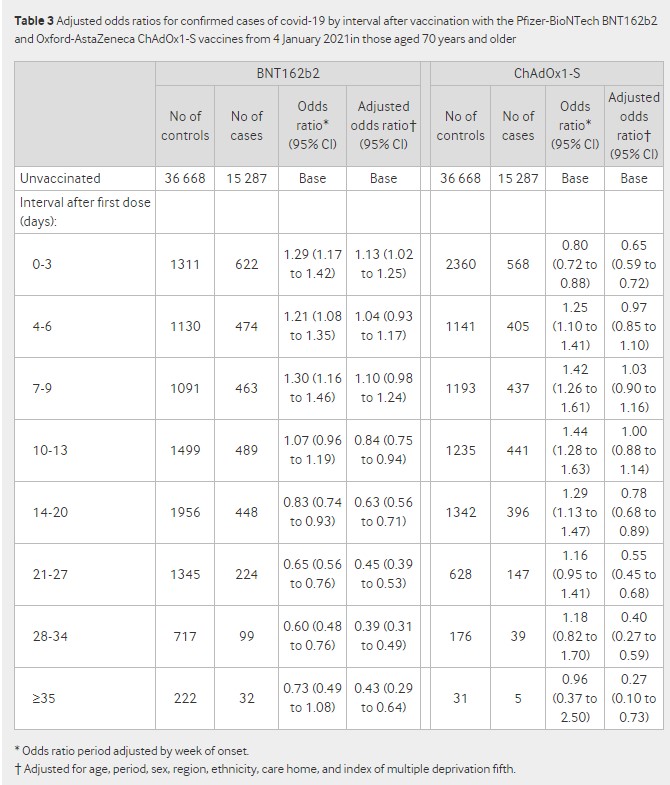
The first thing to spot is that the post-jab spike is still there in the unadjusted odds ratios, getting up to 30% higher for Pfizer and 44% higher for AstraZeneca. But it’s largely eliminated by the adjustments for “age, period, sex, region, ethnicity, care home” and deprivation.
The adjustments also make a huge difference to the later odds ratios. At over 35 days post-jab, Pfizer is only 27% effective (0.73 odds ratio), until the adjustments make it 57% (0.43 adjusted odds ratio). For AstraZeneca the change is even more dramatic: a 4% efficacy (0.96 odds ratio) becomes 73% (0.27 adjusted odds ratio) once adjusted. Any findings where adjustments (which always involve a fair amount of guesswork) make such a difference to outcomes are not really reliable and are an indication that a study with a better design is required.
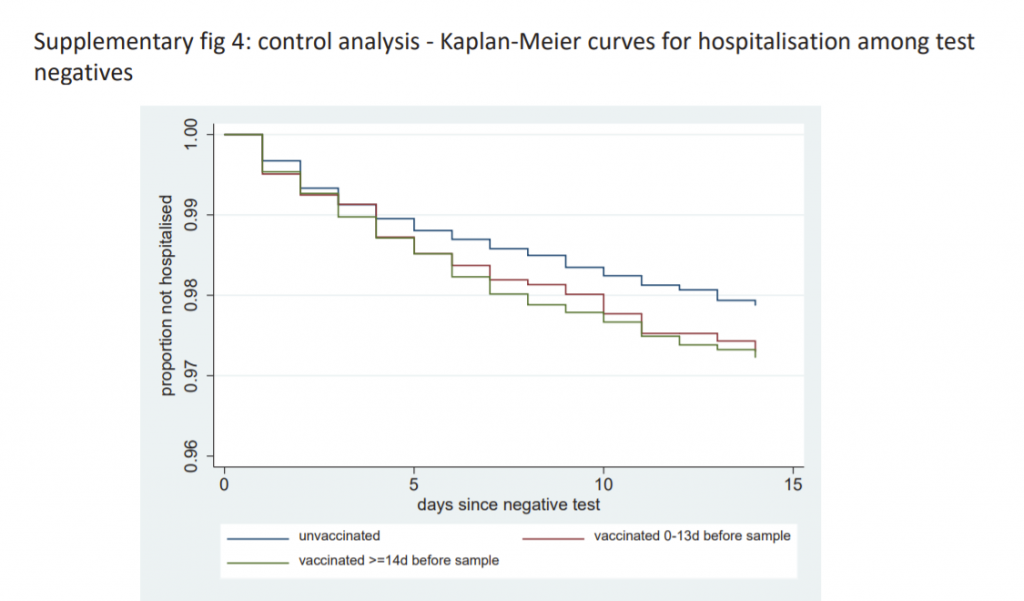
A final note is that those who are vaccinated are hospitalised for non-Covid reasons at a (slightly) greater rate than the unvaccinated. Is this a signal from the vaccine side-effects?
The usual criticisms also apply to this study: there is no statement of absolute risk reduction or number needed to vaccinate, and it is yet another study on vaccine effectiveness without an analysis of safety or risk-benefit.
It’s probably worth me adding that I do actually think the vaccines are effective. The most compelling evidence I have seen so far was from the Oxford study which compared the immunity acquired from vaccination to that from natural infection and showed that in both cases the viral load and proportion of asymptomatic infections was the same.
However, quantifying exactly how effective the vaccines are is proving tricky as all the studies to date are plagued by problems, such as not controlling adequately for changing background incidence so we don’t mistake a declining epidemic for a vaccine working.
This study’s explanation for the post-vaccine infection spike is inadequate. It claims the spike doesn’t show up in other studies, when it certainly does, and it claims it didn’t occur after January 4th, when this was only true after some severe adjustments to the data. With many vaccine rollouts around the world being accompanied by infection surges, this issue needs looking into properly, not brushing aside. By Will Jones
If you like our work, please consider to donate:
Related posts:
Views: 0
 RSS Feed


 May 23rd, 2021
  Awake Goy
  Posted in
  Tags:
Tags: 

