I write constantly (some would say incessantly and annoyingly) about entitlement spending. And I occasionally write about discretionary spending.
It’s time to address the budget in a comprehensive fashion. Let’s look at five charts to put everything in context and to show how we got into our current mess.
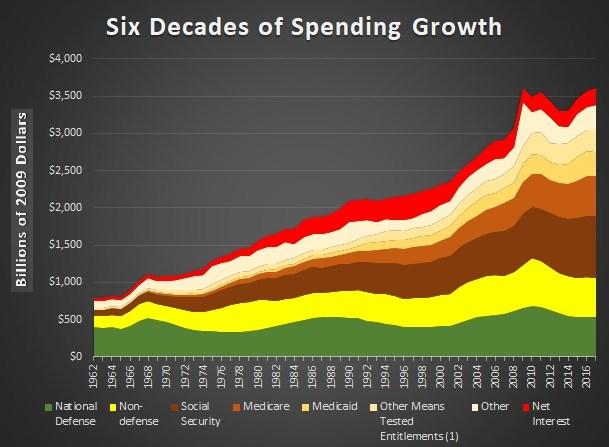
Our first chart (based on Table 8.2 from the Office of Management and Budget’s Historical Tables) shows what has happened to major spending categories from 1962 to 2017. And all the data is in inflation-adjusted dollars (2009 benchmark) to accurately gauge how and why the burden of federal spending has grown.
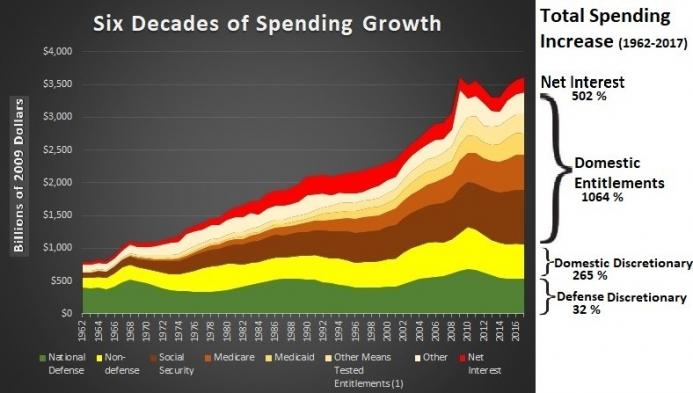
 This next chart shows the actual percentage increases in the major spending categories during this time period. The two big takeaways are that 1) the defense budget is not the cause of our long-run fiscal problems (though that doesn’t mean it should be exempt from cuts), and 2) entitlement expenditures have exploded.
 And if you look at the data I shared from the Congressional Budget Office’s long-run forecast, you would see that these same trends will prevail for the next three decades.
In other words, our fiscal problems start with entitlements and end with entitlements.
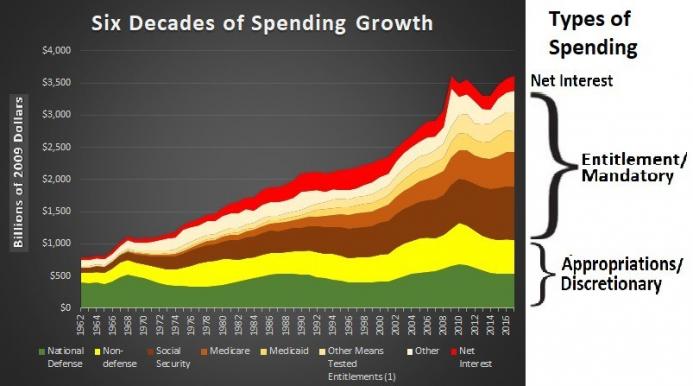
If you want to look at the problem with a broader lens, this next chart shows that the problem is domestic spending (i.e., the combination of entitlement and domestic discretionary outlays).
 If you’re pressed for time, you can stop reading now. You have the key information already.
But if you want to get a bit wonky, here are two other charts that help explain the intricacies of how budgets work (or don’t work!) in Washington.
The first thing to realize is that there are two budget processes in Washington. There are entitlement programs, which basically operate on autopilot. For all intents and purposes, the President and Congress could go on vacation for the next three years and programs such as Social Security, Medicare, Medicaid, and Obamacare would mechanically continue. But there is also “discretionary” spending for the Pentagon and various domestic programs, all of which is determined through an annual “appropriations” process. Whenever you read about a government shutdown, it’s because politicians can’t agree on the level of funding for the discretionary part of the budget.
 Now let’s get to my favorite part, which is figuring out how to limit the size of the federal leviathan.
This last chart shows that net interest spending is genuinely untouchable (unless one wants a Greek-style or Argentine-style default). The rest of the budget, however, can be addressed. Entitlements can be changed through “reconciliation”, which is a legislative process designed to minimize procedural roadblocks (in general, tax bills also use reconciliation legislation). And discretionary programs can be changed via annual appropriations legislation.
Source Article from http://feedproxy.google.com/~r/ActivistPost/~3/aZy50IRp7Y8/everything-need-know-federal-spending-five-charts.html
Related posts:
Views: 0
 RSS Feed


 March 3rd, 2018
  Awake Goy


 Posted in
  Tags:
Tags: 


