Abstract
Kerala, the South-Western State in India with a population of 35 million was in the global limelight for successfully flattening the covid curve and for the lower case-fatality ratio (CFR) during the first year of the pandemic. Ten months down the line, the State is again in the media glare for successfully implementing the covid vaccination drive. Kerala’s vaccination drive began when the infection rate was low. About 4.2 million cases, 85% of the total caseload, were added in Kerala during the vaccination drive. During the past fortnight, Kerala reported more than half of the new cases in India. With a test-positive rate (TPR) of 10%, stable during the past six weeks, the State is not in the safe zone as yet. The Government claims that the vaccines have protected the people from infection, severe illness and death. This paper examines the available data on these outcomes. Part I is a backgrounder of the pandemic and the efforts to contain it. Part II analyses the available data on infections among the vaccinees during September-October 2021. Part III takes stock of the number of covid patients in hospitals, intensive care units (ICU) and on ventilators during December 2020- October 2021. Part IV looks at the case-fatality ratio (CFR) during the entire duration of the pandemic. The results are: (a) more than half the infectees were vaccinees; the infection rate was higher among the fully vaccinated (b) spike in hospital admission and occupancy of ICU/ventilators during the past six months, (c) CFR during June – October 2021 was twice that of the earlier six months.
PART-1 : BACKGROUNDER
India’s first case of Covid-19 was confirmed from Thrissur district of Kerala State on 30 Jan 2020. With five million cases and 30,000 deaths till October 2021, Kerala logged 14% of cases and 6% of deaths in India. Total infection rate per 1000 people and Case Fatality Ratio (CFR) per 1000 cases in Kerala and India (in parenthesis) is 138 (25) and 6 (13) respectively. From the beginning in January 2020 till March 2021, Kerala successfully flattened the covid curve, with infection rate per 1000 people around 0.2/per day. As of now, Kerala’s total infection rate is the highest among the Indian States, and is equal to that of the US. The pandemic In India had two waves that peaked in September 2020 and May 2021. Kerala had three peaks in September 2020, May 2021 and August 2021. (Figure 1)
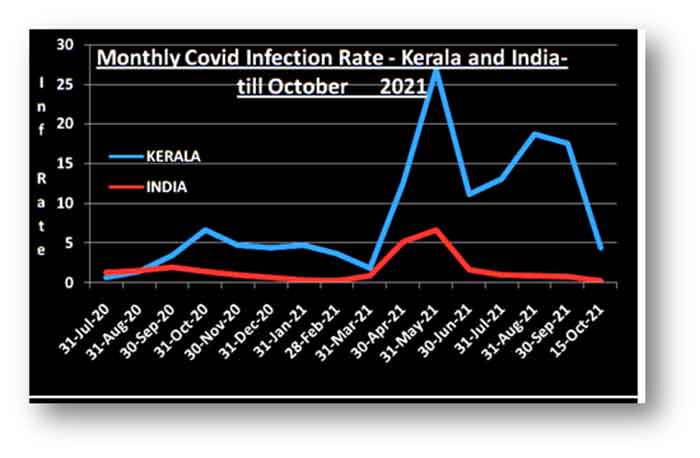
Figure 1: Panoramic view of the pandemic in India and Kerala
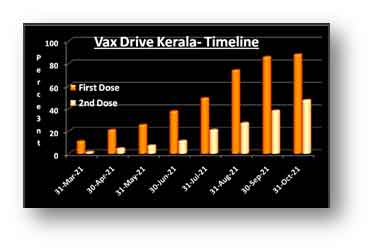
Vaccination Drive in Kerala. Oxford University- AstraZeneca’s Covishield and ICMR-Bharat Biotech’s Co-vaxin received emergency use authorisations (EUA) in people aged 18 years+ in India. Kerala’s vax drive began on 16th January, 2021. After vaccinating health care workers (HCW) and frontline workers, the focus of the campaign shifted to the general public. Jabbing of age groups 60+ years, 45-59 years and 18-44 years commenced on 1 March, 1 April and 1 May respectively. By the end of October, Kerala had administered over 30 million doses among 25 million people in a record time of 242 days. Of the eligible population, 94% received one dose and 47% received two doses. About 90% of the vaccinees received Covishield. Timeline of the vax drive can be seen in Figure 2.
Trajectory of the Pandemic during the Vax Drive
The epidemic was well under control during the beginning of the vax drive in Kerala. At the end of the third month of the drive, when 18% of the people were jabbed, the pandemic curve touched its nadir, with infection rate of 0.07 per day. The rate started increasing since April 21, peaking at 1.1/day during mid-May. This second wave ended in June; the third wave began a month later with its peak infection rate of 0.9/day during August 21. The rates started falling again beginning September. During October 2021, the infection rate was 0.26/day and the test positivity rate (TPR) was around 12%. Daily infection rate per 1000 people during the vax drive can be seen in Figure 3.
 |
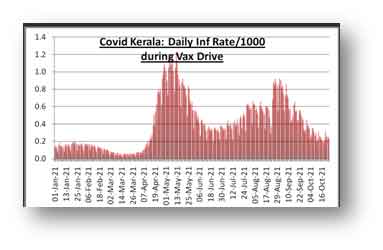 |
| Figure 2: Time of Kerala’s vax drive as on 31 Oct 21 | Figure -3 : Daily Infection rates during the vax drive |
PART-II : BREAKTHROUGH INFECTIONS
Vaccines do not offer 100% protection. Breakthrough infections (infection among the vaccinees) have been reported from India and other countries. On 09 August 2021, the India SARS-CoV-2 Genome Consortium (INSACOG), a group of laboratories coordinated by the Department of Biotechnology (DBT), Government of India, said in its weekly bulletin:
“In view of large number of breakthrough infection, State officials in Kerala have been requested for details regarding timeline of such infections in various districts in terms of vaccine type, duration, disease severity etc for better clarity on variant prevalence and vaccine efficacy. Current genomic analysis of around 200 samples of breakthrough infections indicates presence of Delta variant. At present, there is no evidence on any other VOC (variant of concern) as the cause.
The details sought by the INSACOG are not available in the public domain. Quoting sources in the Union Health Ministry, The New Indian Express reported on 30 August 21 that there were 40,000 breakthrough cases in Kerala, 47% of such cases in India. The officials in Kerala responded that the number of cases is around 4000-5000.
Full data on infection among vaccinees in Kerala is not available. The Director of Health Services (DHS) has kindly provided the daily data on vax status of infectees since 22 Sep 21. I have compiled this data for 40 days from the daily bulletins of DHS. There were 4.1 lakh confirmed cases of which 2.3 lakh cases were among the vaccinees. Please see the summary in Table – 1. (Note: Vax1 = partially vaccinated with one dose, Vax2 = Fully vaccinated)
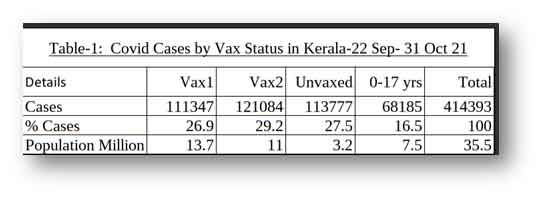
During the period, 56% of the cases were reported among the vaxed cohorts. DHS daily bulletin dated 03 Nov 2021 says that during June, July and August 2021, 6% and 3.6% of the infectees were vaccinees with single and two doses respectively. Between August and October, the percentage of cases among the single-dose and fully vaxed cohorts increased by 4.5 and 8 times respectively.
The rates of infection among different groups will give us a clearer perspective. Before the vaccination drive, the infection rate was derived by dividing the number of cases with total population under the assumption that all uninfected individuals are susceptible. This is not the case post-vaccination. In the phase-3 clinical trials conducted in England, S. Africa and Brazil, the vaccine -efficacy (VE) of two doses of Covishield against infection was 67%. Analysis of the real world data by the Oxford University, (reported in Nature on 19 August 2021) shows that AstraZeneca “was 61% effective against a high viral load 90 days after the second dose”. For this analysis, I estimate that two doses will protect 60% and one dose will protect 30% the vaccinees. The susceptible population therefore, is 40% of the fully vaxed and 70% of the first dosers.
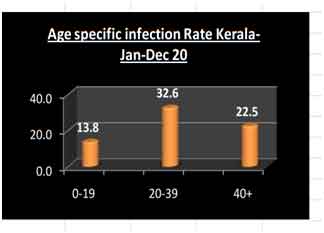
The vax groups in Kerala differ in their age composition and there is a significant difference in infection rates among the age groups. The age specific infection rates and the age-distribution of vax groups are given in figures 4 and 5.
 |
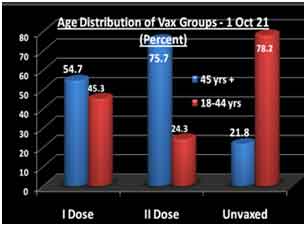 |
| Figure 5: Age Specific Covid Infection rates- Kerala 2020. (DHS weekly bulletin in January 2021). | Figure 6: Vaccination Groups’ age distribution, Kerala. Source: Daily Vaccination Bulletins, DHS |
Details of total and susceptible Population and Infection Rate in Kerala during 22 Sep- 31 October are in table – 2. Infection rates by total population and susceptible population as defined above can be seen in Figure 7.
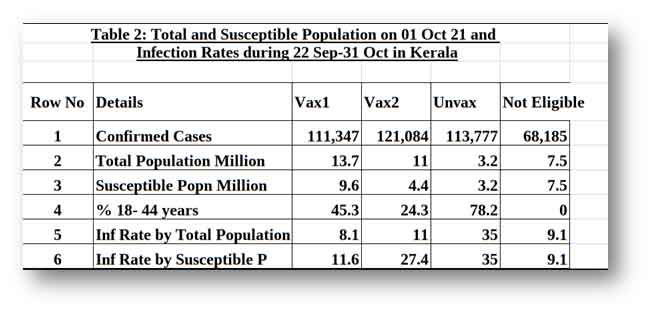
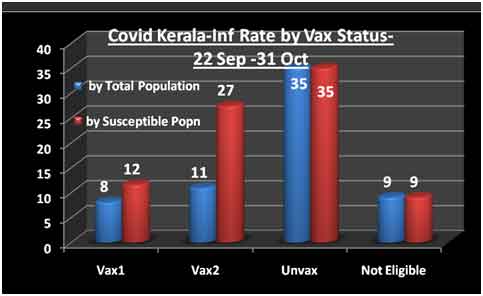
Figure 7: Infection Rates by Vax Status: Kerala 22 Sep-31 Oct 2021
A higher infection rate is expected in the unvaxed due to the higher proportion of susceptible age group 18-44 years. The infection rate in fully vaccinated group is only 23% lower than that of the unvaxed. At the same time, the rate among the fully vaccinated is 2.25 times higher than that of the single dosers. This is an anomaly that needs to be explained.
Change across time by Vax Status – 22 Sep – 31 Oct 21
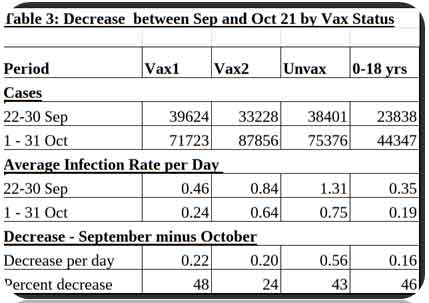
The pandemic in Kerala was on the decline since September 2021. The disaggregated data for the nine days of September and 31 days of October is given in table 2. Average daily infection rate per 1000 in the susceptible population (as defined above) is given in rows 3 and 4. The decrease in infection rate between September and October is given in row 5 and the percentage of decrease is given in row 6.
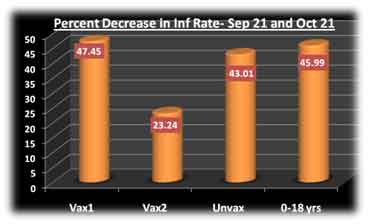
The percentage of decrease among the fully vaxed is 28, as against 43, 46 and 48 in the other three groups. Decrease has been slower among the fully vaccinated cohort. Figure 8 shows the percentage decrease among different vax groups between September and October 2021. The date-wise infection rate by vaccination status can be seen in Figure 9.
 |
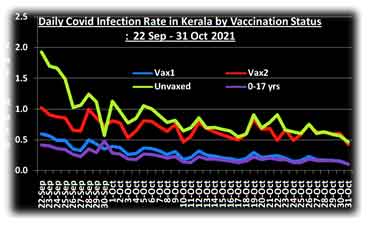 |
| Figure 8: % Decrease of infection between Sep and Oct | Figure 9: Daily infection rate by Vax group- Sep-Oct 21 |
Infection among the Health Care Workers
The health care workers (HCW), many of whom are on patient-facing duty, were the first group to be vaccinated. A Technical Report from the DHS, uploaded in November 2021 says that the percentage of vaccinees among the positive HCWs ranged from 42 to 74 during April-July 2021. The report does not show the numbers of subjects, doses delivered or any other details. On 11 May 21 quoting an office bearer of the Kerala Government Medical Officers Association (KGMOA) the ANINews reported that “over 1000 HCWs in Kerala tested COVID positive in last 10 days”. (On 10 May 21, there were 33,059 covid patients in hospitals, 3981 in ICU/ventilators, the highest number during the season.)
No trend or Pattern
This analysis of cases among the vaccinated and the unvaccinated does not show any clear pattern or trend. The vaxed groups have slightly lower infection rates than the unvaxed, which is far below the expectations. At the same, the higher rate among the fully vaccinated than the single dosers is counter-hypothesis.
PART-II: DATA FROM THE HOSPITALS – DECEMBER 2020- OCTOBER 2021
The data used in this analysis is from the DHS daily bulletins on the last days of the months of December 2020 to October 2021. During these 11 months, there were 4.36 million confirmed cases. On the last days of the months, there were 1.43 Million active cases, and 206,609 were in hospitals. Among the inpatients, 8.6% and 3.3% were in ICU and on ventilators respectively. This study includes only about one-third of the total hospitalised patients.
These numbers are sensitive to the management strategies and expansion of infrastructures. For instance, in response to the surge in the demand for hospital beds, the Government on 25 April 2021 revised the discharge guidelines to shift the patients with no symptoms for three consecutive days to home quarantine, without insisting for a negative test result. Likewise, doubling the number of non-ICU oxygen beds during May 2021 has reduced the demand for ICUs.
During the 11 months, there were two distinct periods of low and high infections. In the first five months (December 20– April 21), the average number of new cases per day was 6450, as against 18,800 during the last six months. Period-wise hospital data are shown in Table 3.

Figure 10 shows the percentages of active cases in hospitals and the percentages of inpatients in ICU and on ventilators by periods. In spite of the change in discharge policy, the percent of active patients in hospital registered a 44% increase during May-October 2021. The percentages of in-patients in ICU/ventilator also increased during May-October.
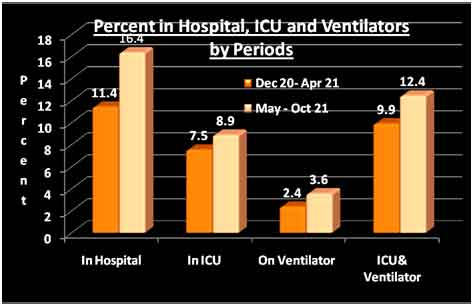
Figure 10: Hospital Statistics – Dec 20-Apr 21 and May-Oct 21
Figure 11 shows the percent of inpatients in ICU and on ventilator increasing from January through March before the depression in April. The lines rise again since May, climbing up never-seen peaks during October. The ratio of patients on ventilators and ICU (Figure 12) registered a secular increase since December 2020. This indicates the deterioration of the condition of seriously ill patients to critical stage. The patients on ventilator have a higher mortality risk than those in ICU.
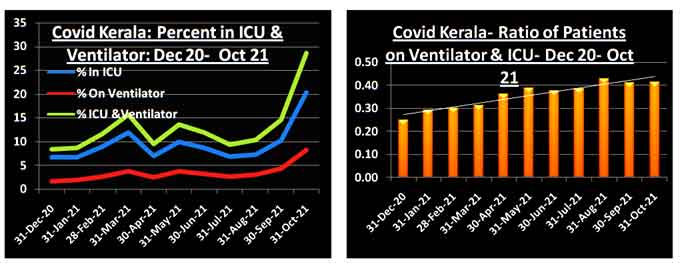
| Figure –11: Percent of cases active and in hospital | Figure 12: Ratio of patients on ventilators and ICU |
PART- III: DEATH AMONG COVID CASES DURING MARCH 2020- OCTOBER 2021
Kerala’s dashboard provides time-series data on confirmed, active, recovered and deceased cases- one line per day. I have used the data on recoveries and death for this analysis from the beginning of the pandemic till 20 October 2021.
As a result of change in the definition of Covid death by the Indian Council of Medical Research, about 7,000 deaths among confirmed cases which were treated as non-covid death were placed under re-appraisal in Kerala. The reappraised deaths are being added since 22 October 2021, without showing the dates of death. (The DHS daily bulletin for 03 November 21 says, the list of these death “will be very long as we are declaring cumulative cases” and “these are available with the DMO and can be verified on online portal”. This portal has district-wise details of all deceased persons, and does not show the newly added cases separately”.) Since inclusion of these added deaths will exaggerate the mortality risk during October, I have used the death data till 20 October 2021 only.
The dashboards estimate the CFR by dividing the number of deaths by the total confirmed cases of the day or the period. Since death usually occurs after 10 or more days after RT PCR confirmation, the fatality ratios for the last period will be deflated if the pandemic is on growth phase and vice versa. To overcome this, the denominator used in this analysis is the number of decided cases, which is the sum of recoveries and deaths.
Figure 13 shows the daily Covid CFR in Kerala during October 2020 to October 2021. The fatality ratio has been rising, falling and rising again.
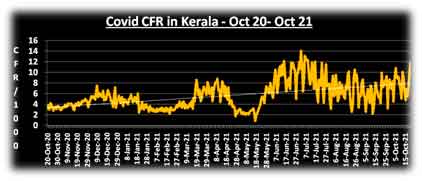
Figure 13: Daily CFR in Kerala – October 20- October 21
For seeing the trend across time, the data is grouped into three periods – (a) January- July 2020, (b) August 2020 –- May 2021 and (c) June- October 2021. (Data in Table 4). During the first six months of the pandemic, CFR in Kerala was 5.6/per 1000. It steadily declined to 3.8/1000 during August 2020- May 2021. During the last five months, CFR more than doubled. Figure 13 captures this fall and rise. CFR has fallen after about the first six months of the pandemic in other places as the care-givers learnt more about the virus and its ways. If we consider the middle period as the norm, there should have been 9416 deaths in Kerala during June-October 2021. The estimated excess death in the State during June-October is 8853.
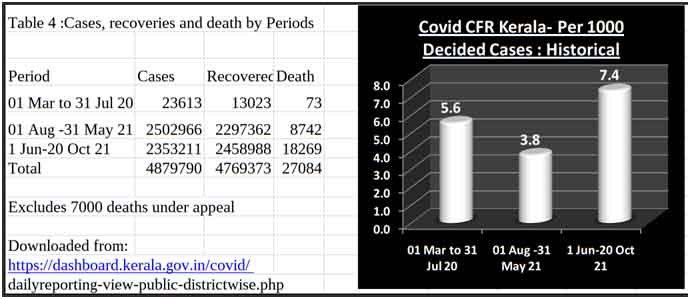
Figure 14: Covid CFR by periods
Is Delta Strain the Villain?
Is Delta, currently the dominant strain in Kerala, the villain behind the doubling of CFR during the past five month? The strain is known for its higher transmissibility, but there is no estimate of its CFR. Summary data from a study of more than a million genotyped cases with 8250 deaths in England, released by The Public Health England, (now the UK Health Security Agency- UKHSA) is given table 5. The Delta CFR is 5 per 1000 as against 19.2 per 1000 of Alpha strain. Delta looks more like the common flu. (See figure 15).
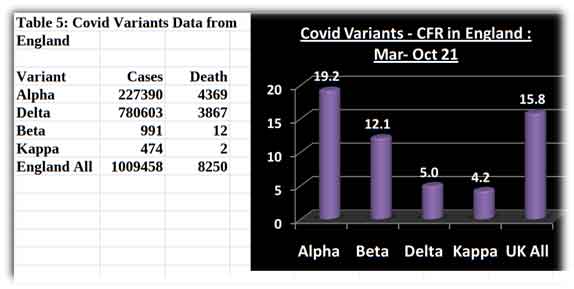
Figure 15 Mortality Risks of Delta and other variants in England
The Findings in a nutshell
Covid cases among the vaccinated. During the 40 days of September-October 2021, 56% of the cases were reported among the vaccinees, and the top scorer was the fully vaccinated group. Infection rate among the fully vaccinated group was two and a half times higher than that among the partially vaccinated. Between September and October, infection rate decreased in all groups, but much slowly in the fully vaccinated.
Hospitalisation, ICU and Ventilators. In comparison to December-April, the percentage of active cases in hospital increased during May- October by 40%, the percentage of inpatients in ICU and on ventilators increased by 25%, and the ratio of patients on ventilator to ICU increased by 25%.
Mortality Risks. Between August 2020- May 2021 and June-October 2021, the CFR almost doubled from 3.8 to 7.4 per 1000.
Discussion
The global scenario- post vaccination. Of late, the pandemic has been on a surge in several countries with high vaccination rates. New York Times vaccination-tracker provides the country-wise vaccination data in the form of doses per 100 people. A score of 200 means that all persons have received their two doses. There are countries with dose above 200, which means that some people have received the third dose known as the boosters. Germany, UK and Belgium are among the top countries with doses ranging from 135 to 206. Doses in S Africa, Pakistan, Philippines and India ranges from 39 to 79. With a dose of 114, Kerala State stands in between and closer to the toppers. Vax doses (per person) and infection rates (per 1000 people) during the last fortnight (ending 10 Nov 2021) in these countries and Kerala State can be seen in Figure 16. (Data Source: Worldometer) Several highly vaccinated countries are now in their fifth wave, which is also the first post-vax-drive wave.
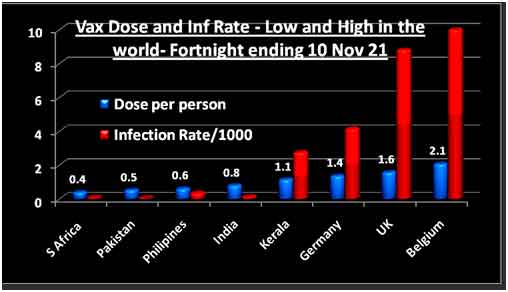
Figure 16: Vax Dose and Infection Rates – Select Countries
Technical Report on breakthrough infections. The DHS portal has a 14 page technical report on breakthrough infections in Kerala. This unsigned, undated document appeared during the first week of November 2021. The Report has data and analyses from several countries, which are not referenced properly. The only data from Kerala is the percentage of vaccinees among the positive HCWs from the Medical College Hospital Thiruvananthapuram, which was 42% to 76% during April-July 21.
There is a section of “data from countries which have fully vaccinated more than 50% of their population”. The section begins with the statement: “Even in countries with very high vaccination coverage, breakthrough infections are reported, however the hospitalization, severe infections and death are far less compared to pre-vaccine era”.
A table which follows this statement (reproduced below) lists the number of cases and death on one single day before and after vaccination. Singapore has 55 cases and zero death before vaccination, and 58 cases and 1 death after vaccination. This does not prove that ‘death is far less post-vaccination. Singapore’s infection rate and CFR during pre-vaccination, vaccine drive and post-vaccination eras, are given in Figure 17. (Data from Worldometer.)
DHS Analysis of Breakthrough Cases in Kerala
Since 6 September 2021, the DHS daily bulletin includes a one-page analytical report. Some quotable quotes from the latest bulletin:
Quote No 1: “Based on the data during June, July and August, 6% of the Covid positive patients had taken a single dose and 3.6% had taken two doses of covid 19 vaccines. This indicates that vaccinated people may get infected, even though it is very less. It indicates that post vaccination immunity is effective in preventing infection.”
Comment: Why the data of June-August? Truths about Vaccine-efficacy and virulence of virus are relative ones; they can change by the day. Why the bulletin does not quote the data for recent months and also ignores the HCW study (in the Technical Report mentioned above) which shows a higher proportion of vaccinees among the infectees?
Quote No 2: COVID-19 vaccines protect people from getting infected and become severely ill, and significantly reduce the likelihood of hospitalization and death. • During October 31-November 6, the average active cases were 74,976 out of them an average of around 1.8% only were admitted in oxygen beds and 1.4% were in ICU. During this period there was a decrease of around 7806 new cases
Comment. The analyst projects the small daily decreases in infection since September as proof of vaccine efficacy. By that logic, it can be argued that the surges during April –August 2021, when about half the people were vaxed, were vaccine-induced. Moreover, while the number of cases has been declining since September, the percentage of hospitalisation and occupancy of ICU beds has been steadily increasing.
Are the vaxed people among the drivers of the pandemic now?
The INSACOG, an apex expert body stated in its bulletin dated 09 August that “breakthrough infections are likely to be more transmissible.” Was the vaccination also among the drivers of the pandemic in Kerala during the third wave?
Conclusion
Kerala has one of the highest vaccination rates and also the highest infection rate in India. The test positivity rate (TPR) is still above 10%, more or less stable during the past 6 weeks. More vaccinees are becoming infectees, proportions of hospitalisation and occupancy of ICU and ventilators are also increasing, and the case-fatality ratio has nearly doubled during the past five months. At present, the State is still is still in the danger zone; the arrival of a fourth wave cannot be ruled out. Wishful thinking about the end of the pandemic with vaccines is the last thing we should be doing at this critical point in history.
SV Subramanian from the Harvard Center for Population and Development Studies, and TH Chan School of Public Health, Boston, reported in the European Journal of Epidemiology that increases in cases of COVID-19 are unrelated to levels of vaccination across 68 countries and 2947 counties in the United States. After suggesting that “even as efforts should be made to encourage populations to get vaccinated it should be done so with humility and respect” he reminds us that “other non-pharmacological prevention efforts needs to be renewed in order to strike the balance of learning to live with COVID-19 in the same manner we continue to live a 100 years later with various seasonal alterations of the 1918 Influenza virus.”
An observational study like this based on limited data cannot prove the causative relationship between an agent- a toxin or a vaccine and the health outcomes. This is truer in the case of a pandemic, which is a chaotic event, where “little shifts can have disproportionately sized impacts”. This analysis however, does show that the claim of vaccine’s positive impacts on the pandemic in Kerala is wishful thinking and not fact-based. A systematic and unbiased analysis of the data may help us to prepare ourselves to deal with the next waves, if and when they arrive. The government should release all relevant data on infections and hospitalisation among vaccinees, and the withheld details of 7000 death in a usable format. We all hope for an early end of this crisis of the century with vaccines and covid appropriate behaviour under the guidance of the covid-war-room. And the believers can keep their fingers crossed till the virus mutates to become responsible, non-violent and endemic, seasonally reminding us of its presence in our midst with a common cold.
Author Credentials: With a team of eminent scientists and doctors with expertise in various fields, VT Padmanabhan has coordinated epidemiological studies among children born to parents exposed to high natural radiation in Kerala, children of MIC gas survivors in Bhopal and women living in the neighbourhood of Kalpakam Atomic Power Plant suffering from auto-immune thyroid disorders. His team included. He learned epidemiology from DR Rosalie Bertel, Dr Alice Stewart and Dr Daya Verma. His papers have been published in peer-reviewed science journals. VTP has been a regular contributor of Countercurrents on topics ranging from nuclear safety, coastal zone management and covid-19.
Related posts:
Related posts:
Views: 0
 RSS Feed


 November 15th, 2021
  Awake Goy
  Posted in
  Tags:
Tags: 
